Research
Background
Chronic kidney disease (CKD) is highly prevalent (15%) and mortal disease (109.7 per 1,000 patient-years) [1]. The proposed risk factors of CKD, including age, race, diabetes mellitus, hypertension, and cardiovascular disease, explain only a small fraction of it [2]. Such limited explainability of those risk factors restricts physicians in identifying patients who will experience rapid estimated glomerular filtration rate (eGFR) decline and progress to end-stage renal disease (ESRD).
Serum uric acid (SUA) and its related purine metabolites may have the potential to be a biomarker indicating the CKD incidence and its progression. One proposed mechanism of hyperuricemia leading to CKD progression [3] is via activation of the renal renin-angiotensin system [4-8] and inflammation [9, 10]. SUA is a significant predictor of eGFR decline and albuminuria [11, 12] and is related to kidney-related mortality [13, 14]. Therefore, it is critical to examine SUA levels and their relation to kidney health and eventually find an optimal level of the SUA to preserve kidney health and prevent kidney failure.
By integrating the prospective cohort studies and quantitative modeling, we will identify uric acid, as an early kidney function decline biomarkers in purine metabolism, with prospective cohort studies and investigate the predictive role of SUA in non-diabetic CKD progression. This model will give an individual prediction to prevent CKD progression in clinical practice.
Research Question
Main idea: Uric acid and its related metabolites in the purine metabolism pathway are early biomarkers for renal injury and proteinuria in non-diabetic CKD.
Research Question 1) Are SUA and its metabolites (esp. Allantoin) associated with CKD and ESRD incidence?
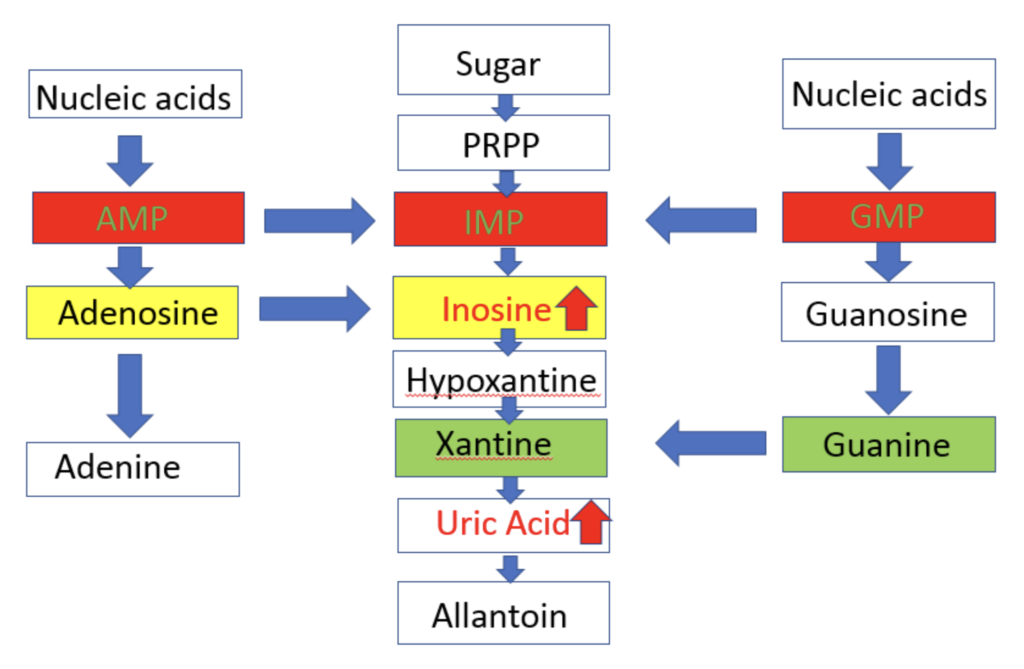
In collaboration with Drs. Cheryl Winkler, Jeffery Kopp, and Thorkell Andersson, we did a pilot study of untargeted metabolite profiling in group (5 each) by HIVAN (HIV associated nephropathy) vs. HIV (+) control and APOL1 high FSGS (Focal Segmental Glomerulosclerosis) vs. APOL1 high risk healthy control.
Inosine and uric acid in purine pathway showed a significant increase.
Analysis Plan
HIVAN selected from banked plasma collected as part of NIH cohort study
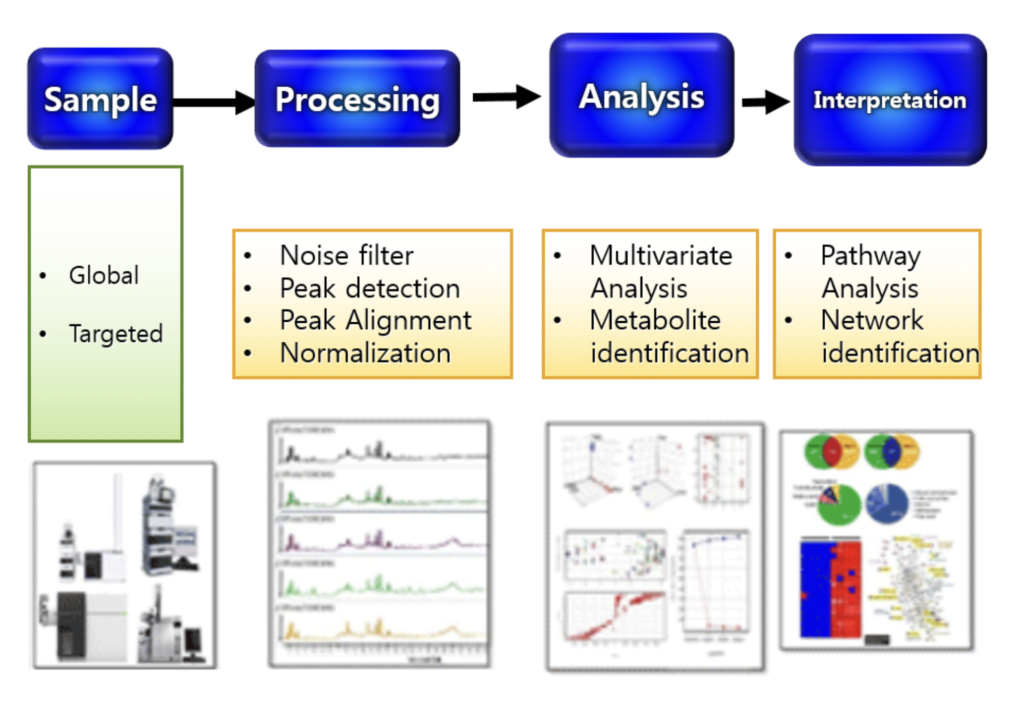
Mann-Whitney U test for the comparison of the peaks
Corrected by using the false discovery rates (FDR)
Logistic regression model to evaluate association of metabolite peak areas with the presence of HIVAN or CKD
Identifying the significant peak areas, using the National Institute of Science and Technology (NIST) library and Metlin database if necessary
After identifying significant metabolites, pathway analysis will be performed using Ingenuity Pathway Analysis (IPA)
Kruskal-Wallis tests (non-parametric ANOVA) to identify differences in plasma metabolite concentrations between groups.
Research Question 2) Is the genetic component of SUA related to CKD progression?
Analysis Plan
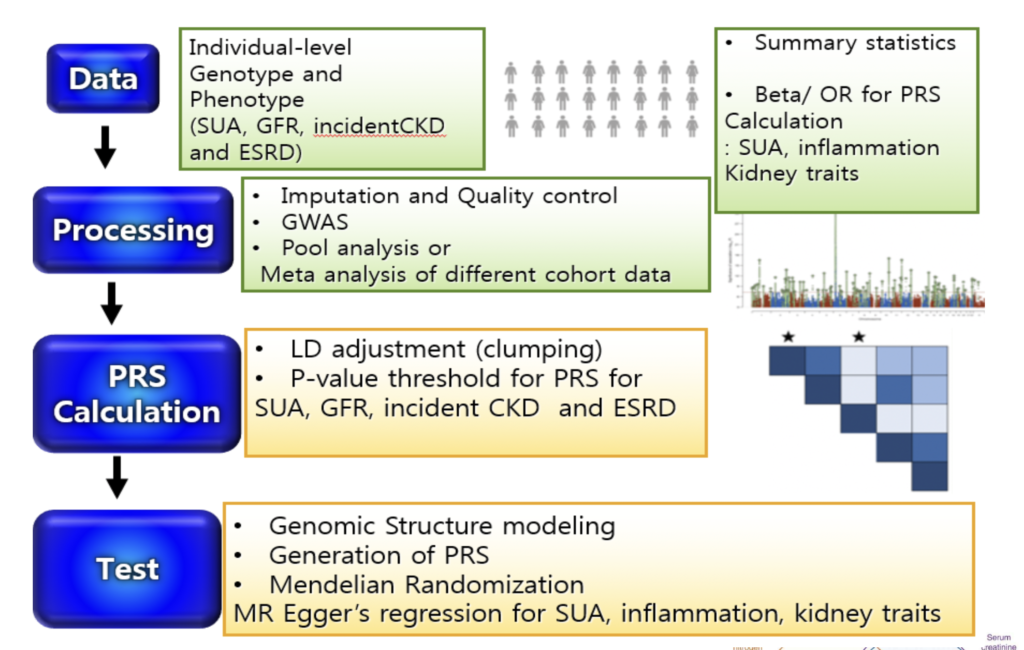
GWAS of SUA and kidney trait (eGFR based on serum creatinine and on Cystatin C) in AAs for healthy and CKD cohorts
Cross-trait LD Score regression (LDSR) to estimate genetic correlations between complex traits
Genomic structural equation modeling (SEM) analyzes the joint genomic framework of complex phenotypes using GWAS summary statistics of individual traits with unknown overlap
Polygenic risk score (PRS) to test for associations using the individual-level data of AAs from CRIC and AASK
Two-sample MR analysis GWAS summary statistics for SUA, inflammation and kidney traits to test for putative causal influence of 1) SUA on kidney traits, 2) SUA on inflammation and 3) inflammation on kidney traits
Research Question 3) Does SUA modify factors in the non-diabetic CKD progression (by using the disease progression model)?
Analysis Plan
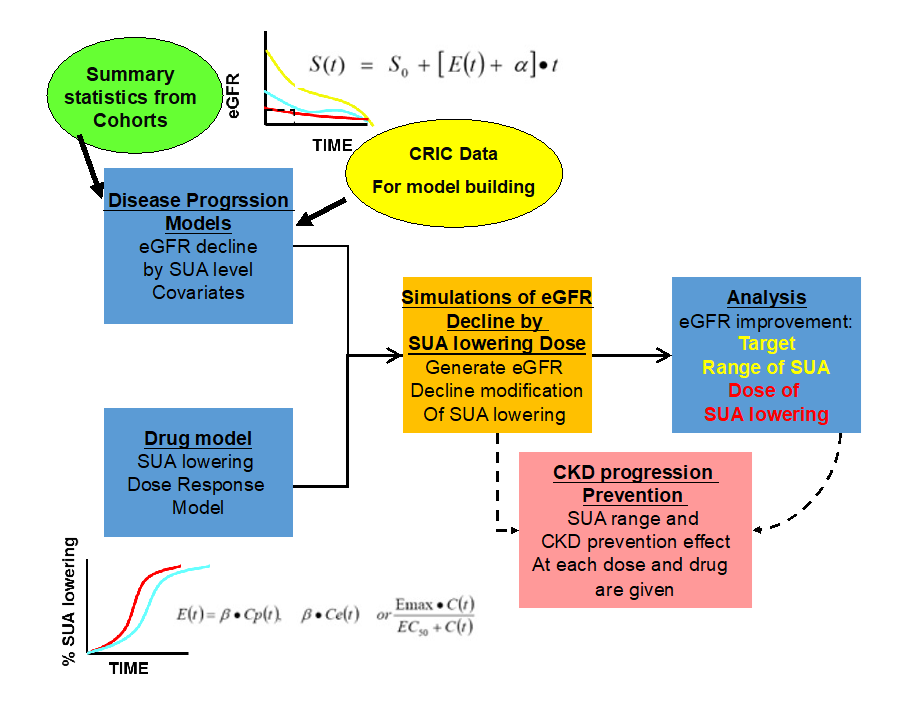
Using the selected metabolites in Q1 & 2, build a disease progression model for non-diabetic CKD progression over time (esp. SUA)
Build the drug model
Based on the previous clinical trial results
Linear, Emax, sigmoid Emax model and indirect response model
Evaluation of how much lowering of SUA will benefit to CKD progression and suggest the dose range of each drug considering each individual disease status
Research Question 4) Is the kidney function attributed to SUA?

Analysis Plan
Using the population attributable fraction (PAF) we estimate the relative risk of the uric acid-related risk factors contributing to the incidence of hyperuricemia. Such estimation would be investigated across a different rage of the eGFR levels.
Then, we would be able to capture the amount of the relative risk of the uric acid-related risk factors contributing to the hyperuricemia, varied by the kidney functioning.
The amount of the relative risk would be modulated by gender and ethnicity.